The first serve percentage in tennis is noisy
Commentators in tennis often look closely at players’ first serve percentage. A high percentage in a set is taken to mean that a player is serving well, while a low percentage is often considered a cause for alarm.
There are several issues with the stat considered on its own. For one, a low first serve percentage isn’t necessarily a bad thing if it’s the result of a calculated risk. It’s possible that a player takes more risk on the first serve, getting fewer of them in as a result, but compensating for this with increased effectiveness. So, really, what matters is the overall win probability on serve, for which you need more information than just the first serve percentage.
However, this isn’t what the post is about. What I’d like to show is that aside from the question of whether a low first serve percentage is truly bad, there is also a lot of randomness in the estimate itself. In particular, commentators often mention it during a set when few points have been played on a player’s serve. Some straightforward statistics shows that even if players have a fixed probability of getting their first serve in, a small sample size means that a wide range of first serve percentages is possible.
Let’s say, for example, that a player’s chance of getting a first serve in is 60%. We’re going to assume that this probability stays constant, so every time a player hits a first serve, the outcome is basically the result of a biased coin toss which comes up heads 60% of the time. Of course this may not be quite right – it’s possible that there are momentum effects, or players might change their tactics, and so on – but all these would just introduce even more noise, so this model should be a conservative one. We’re going to simulate this for 20 points, calculating the estimated first serve percentage each time by computing the fraction of successes.
Here’s what you get when you do this one million times and plot the number of times each of the possible percentages (0/20, 1/20 all the way up to 20/20) is observed. It turns out that this distribution is pretty wide:
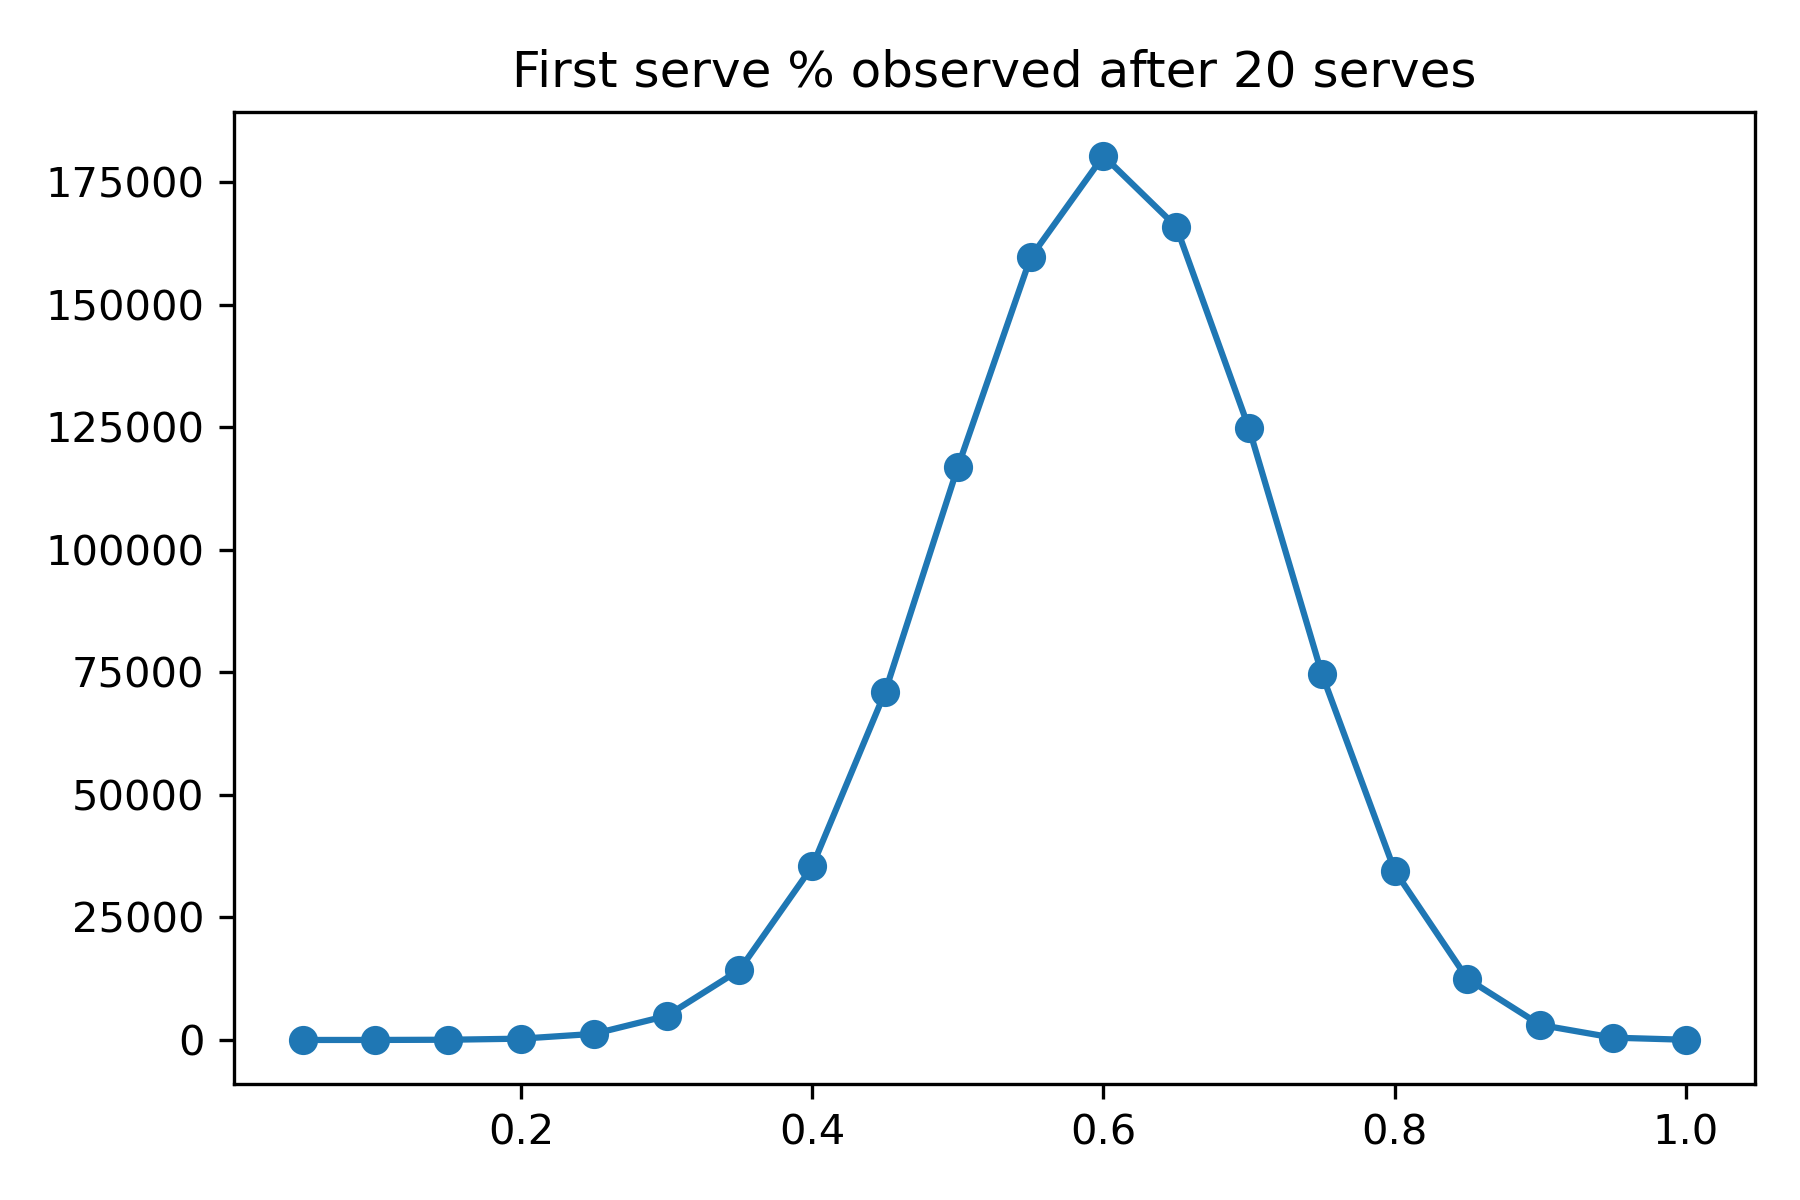
We can calculate the standard deviation of the draws, which is about 0.11. So if a player has a 60% chance of getting their first serve in, we’d expect to see a first serve percentage of $0.60 \pm 0.11$ after 20 serves. In other words, a value of 38% at the low end or 82% at the upper end would not be too shocking. Assuming a service game is about 6.3 points long (which is what we’d expect for a player winning 63% of their service points), this suggests we really can’t say too much after seeing three service games from a player.
So how does this change as we see more serves? It’s easy to simulate this, but we can also use the central limit theorem to save a bit of computation (the answers are essentially the same), under which we expect the standard deviation to be $\frac{\sqrt{p (1 - p)}}{\sqrt{n}}$, where $p$ is the success probability (0.6 in this case) and $n$ is the number of serves. Here’s what that looks like:
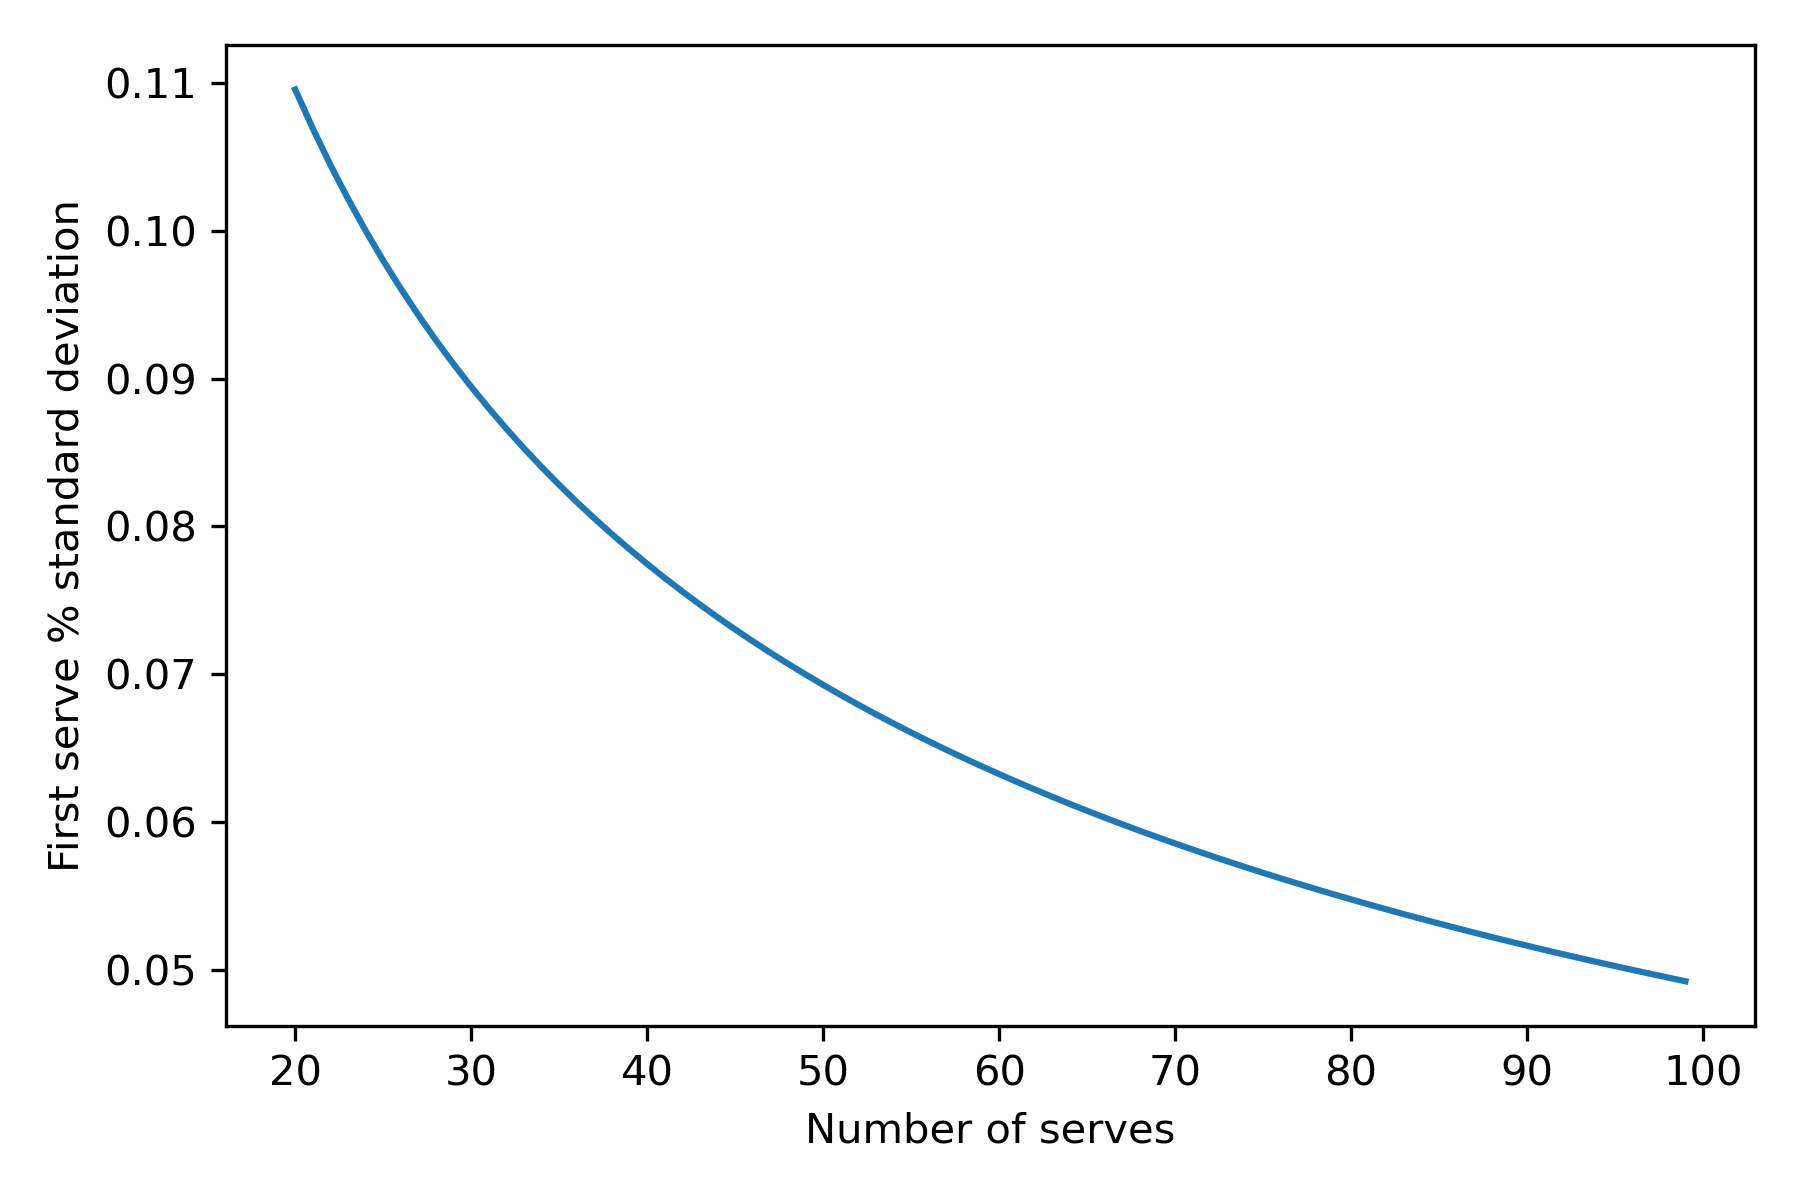
A player serves roughly 30-40 times in a set, so set-level averages are still pretty noisy (about 8% standard deviation) and we wouldn’t be shocked to see first serve percentages between 44% and 76%, even if the true value is 60%.
Does that mean set-level first serve probability estimates are meaningless? I actually think they could be useful, but for a different reason. Assuming a player’s first serve percentage doesn’t shift dramatically over the course of the match and variation is (mostly) due to chance, the first serve percentage might give an indication of luck. If a player loses a close first set, say, but had a lower first serve percentage than their average, this might actually be a good sign: perhaps they won’t be so unlucky in the second set, and it’ll go their way this time.