How good is the UTS format at picking the better player?
Controversial as it is, it’s been fun to watch the spectacle that is the Ultimate Tennis Showdown. Although some of the motivation behind the radical changes to the usual tennis format might be overly alarmist, the event has managed to bring together some big stars, and I’ve enjoyed watching some of the contests.
From a tennis statistics point of view, one thing that’s striking about the UTS showdown is the format: the match is broken down into four quarters, each 10 minutes long. If the match is tied after the four quarters, it goes to sudden death, where the player who is able to win two points in succession wins. I haven’t come across this format before. In general, tennis formats at exhibitions tend to be either variants of the usual sets (such as Fast4), or a sequence of tiebreaks. I haven’t seen a format where the time determines when play is stopped.
How can we evaluate this format? One way is to look at how good it is at picking the “correct” winner. Assuming that each player has a constant probability of winning each point on their serve, we can determine what fraction of the time the player with the higher win probability is picked. Steph Kovalchik and I looked at a number of formats in a paper a while back and found that, as you might expect, shorter formats tend to be worse at doing this, resulting in a larger probability of upsets. That’s not ideal, since we would like the best player to win. So where does the UTS format fit in?
Big caveat: In what follows, I’m not considering the effect of the “cards” that UTS introduces. I’m sure that they can have a huge effect, especially the “winners count 3x” one. I would expect that they magnify randomness, since individual points played under this rule will have an outsize effect. Here, I’ll focus only on the format itself, without taking the cards into account. Also, I did this analysis quite quickly, so there might be some errors. If you see anything wrong, please let me know!
Please note: this article will be fairly maths-y. If you’d like to skip that and go straight to the conclusions, please take a look at the section “How random is UTS?”. With that out of the way, how do we go about modelling the win probability in UTS?
Modelling the probability of the number of points played in a quarter
Unlike in a standard set, the score in UTS doesn’t determine when the quarter is over; the clock does. Given the number of points played, we can calculate the win probability (see next section), but first we need to work out what that distribution is.
First, we need to make some assumptions. I assume that:
- Each point is made up of $N_i$ shots
- The number of shots $N_i$ follows a geometric distribution with parameter $p$
- Each shot takes $t_s$ seconds
- Players take the full 15 seconds between each point
For $t_s$, I am currently assuming that each shot takes 1.5 seconds, but we can play around with that later to see how big a difference it makes.
As for the number of shots following a geometric distribution: the idea here is that each shot hit by a player will end the point with probability $p$. I fit this on Match Charting Project data and found that $p = 0.19$ fits best. This means that we are assuming that each time a player hits a shot, there’s a 19% probability it’ll be the last one in the rally. The mean rally length including the serve is about five shots under this assumption. Using a geometric distribution is a simplification: in reality, due to the dominance of the serve early on in the rally, some rally lengths are more likely than others, but it’s probably not going to make a huge difference for us here.
Given these assumptions, point $i$ takes $T_i = N_i * t_s + 15$ seconds. The total time $T$ given that $k$ points are played is then: $T = \sum_{i=1}^k T_i$.
What we want is the distribution of the number of points given that 600 seconds are played. The simplest way to get this distribution is by simulation: draw $N_i$ from the geometric distribution, calculate the duration for a point with that many shots using the formula for $T_i$, and advance the clock until we hit the time limit. I was feeling fancy and used the fact that because the sum of geometric distributions is negative binomial, the total time given a number of shots is actually a scaled and shifted negative binomial distribution – but simulation works just as well and the results are very similar. In any case, we get the following distribution for the number of points:
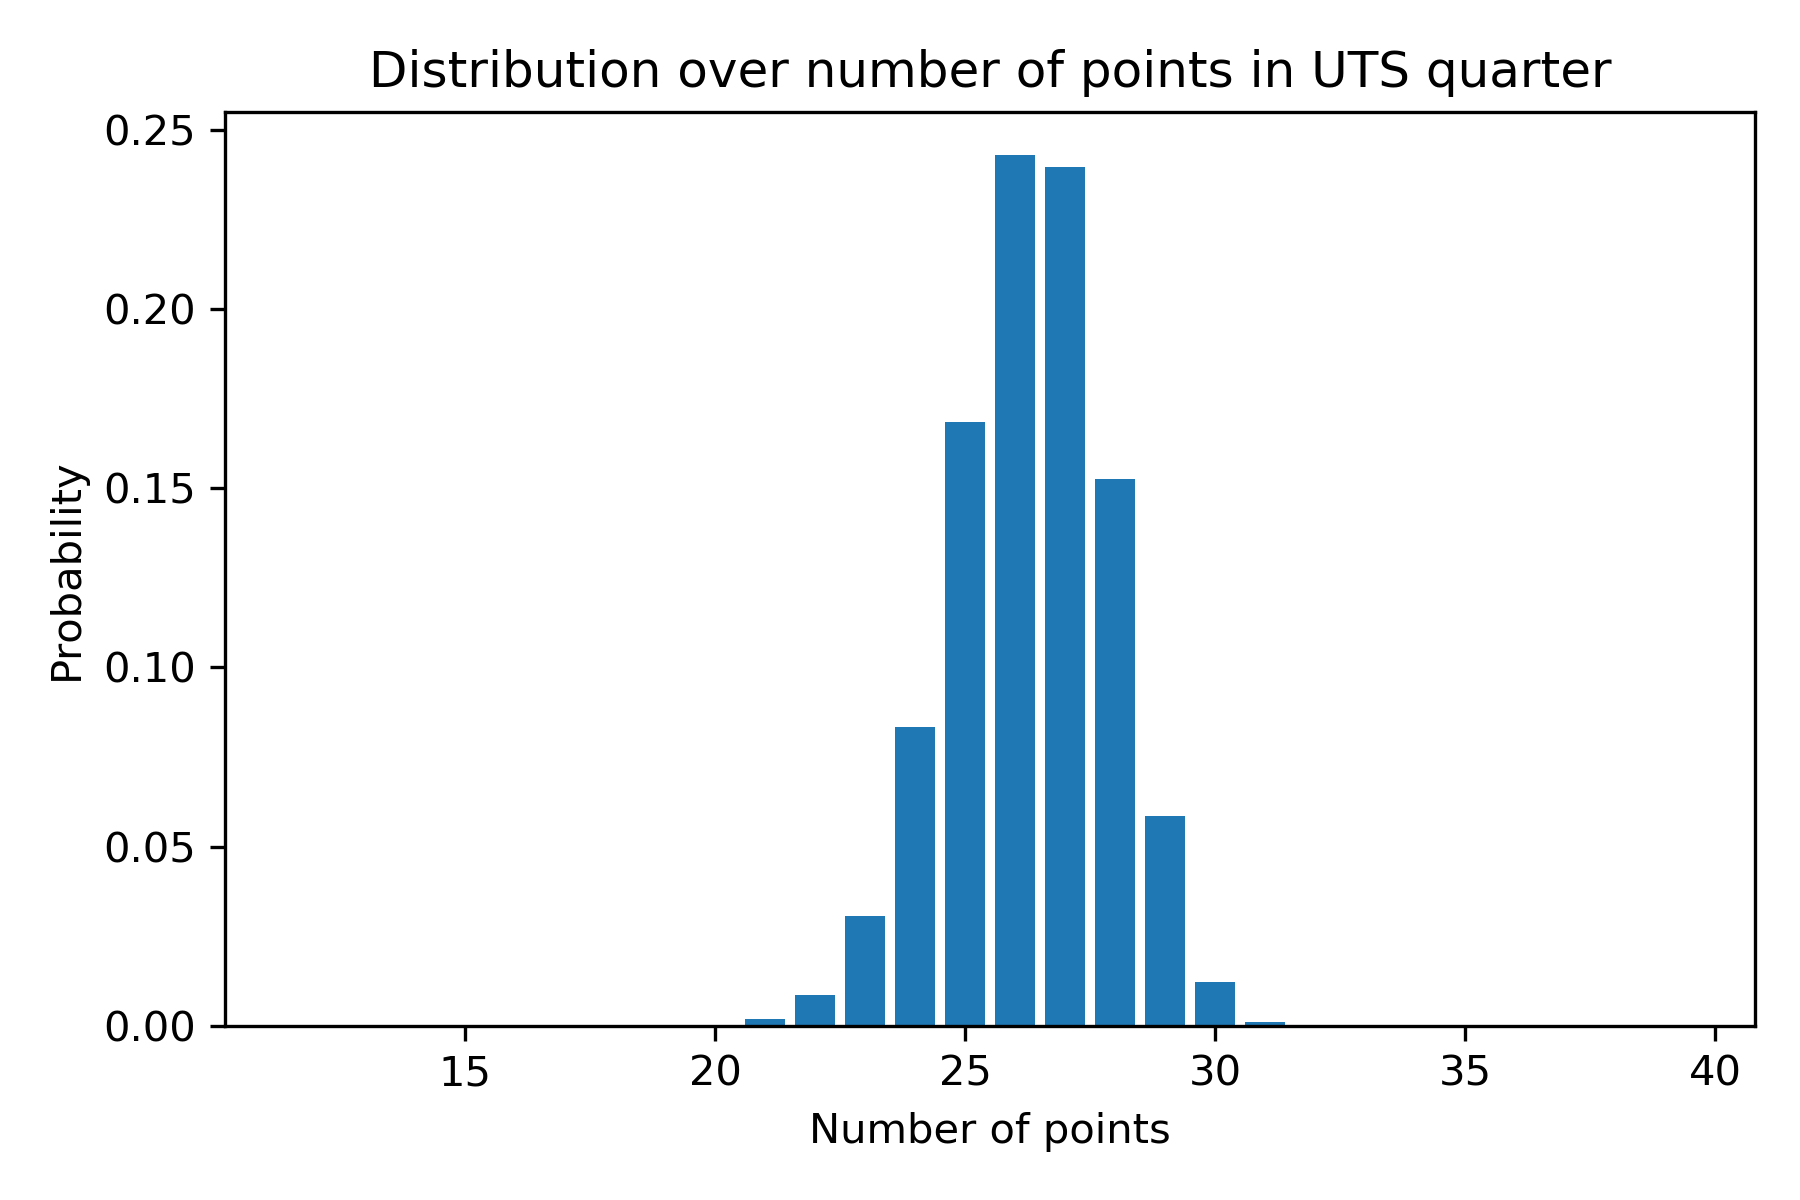
For these assumptions, the mode is at 26 points, but between 21 and 31 points seem possible. It would be interesting to compare this against what has happened in the matches so far, but it’s hard to tell since the point totals include the 3x multipliers.
Modelling the probability of winning a quarter given the number of points
Now, we assume that we know the number of points in the quarter, $K$, to be $K = k$. How do we calculate the win probability?
Here, I make the assumption that each player has a fixed probability of winning each point. Usually, we break things down by who’s serving and who’s returning, but assuming that the starting player is random, there should be a 50% probability of either player serving at each point, so I think it’s OK to make this assumption. It’s worth thinking about whether that’s really true, though, so this might just be a first pass.
That said, I’m more familiar with working with the probability of winning a point on serve, so we can convert those probabilities as in the following example. Assuming that player 1 has a probability of $p_{S1} = 70\%$ of winning points on their serve, and player 2 wins with probability $p_{S2}=60\%$, and that there’s a 50% chance that player 1 is serving, we get:
$p_1 = 0.5 * p_{S1} + 0.5 * (1 - p_{S2}) = 0.55$
Now, we need to consider two possibilities for player 1 winning:
- Player 1 wins the quarter outright by winning more points than player 2
- Player 1 and player 2 win the same number of points, and player 1 wins the deciding point
As mentioned, we assume that the number of points is known to be $k$. Since player 1 has a probability of $p_1$ of winning each point, we model the number of points won by player 1 as:
$Y_1 \sim \textrm{Binomial}(k, p_1)$
Player 1 wins outright if he / she wins the majority of points. After some maths, this turns out to be $1 - p(Y_1 \leq k // 2)$, where we can calculate the second term using the CDF of the binomial distribution, and $//$ denotes integer division.
If we play an even number of points, it’s possible that the outcome is tied. In that case, a deciding point is played, which player 1 wins with probability $p_1$. Putting the two possibilities together, we find:
$p(\textrm{P1 wins quarter}) = p(\textrm{outright win}) + p(\textrm{win via sudden death}) = 1 - p(Y_1 \leq k // 2) + p(Y_1 = k / 2) p_1$
Note that $p(Y_1 = k / 2)$ will only be non-zero if $k$ is even, so this should work out (we can’t have a tied score if $k$ is odd). What does this look like? It looks like this:
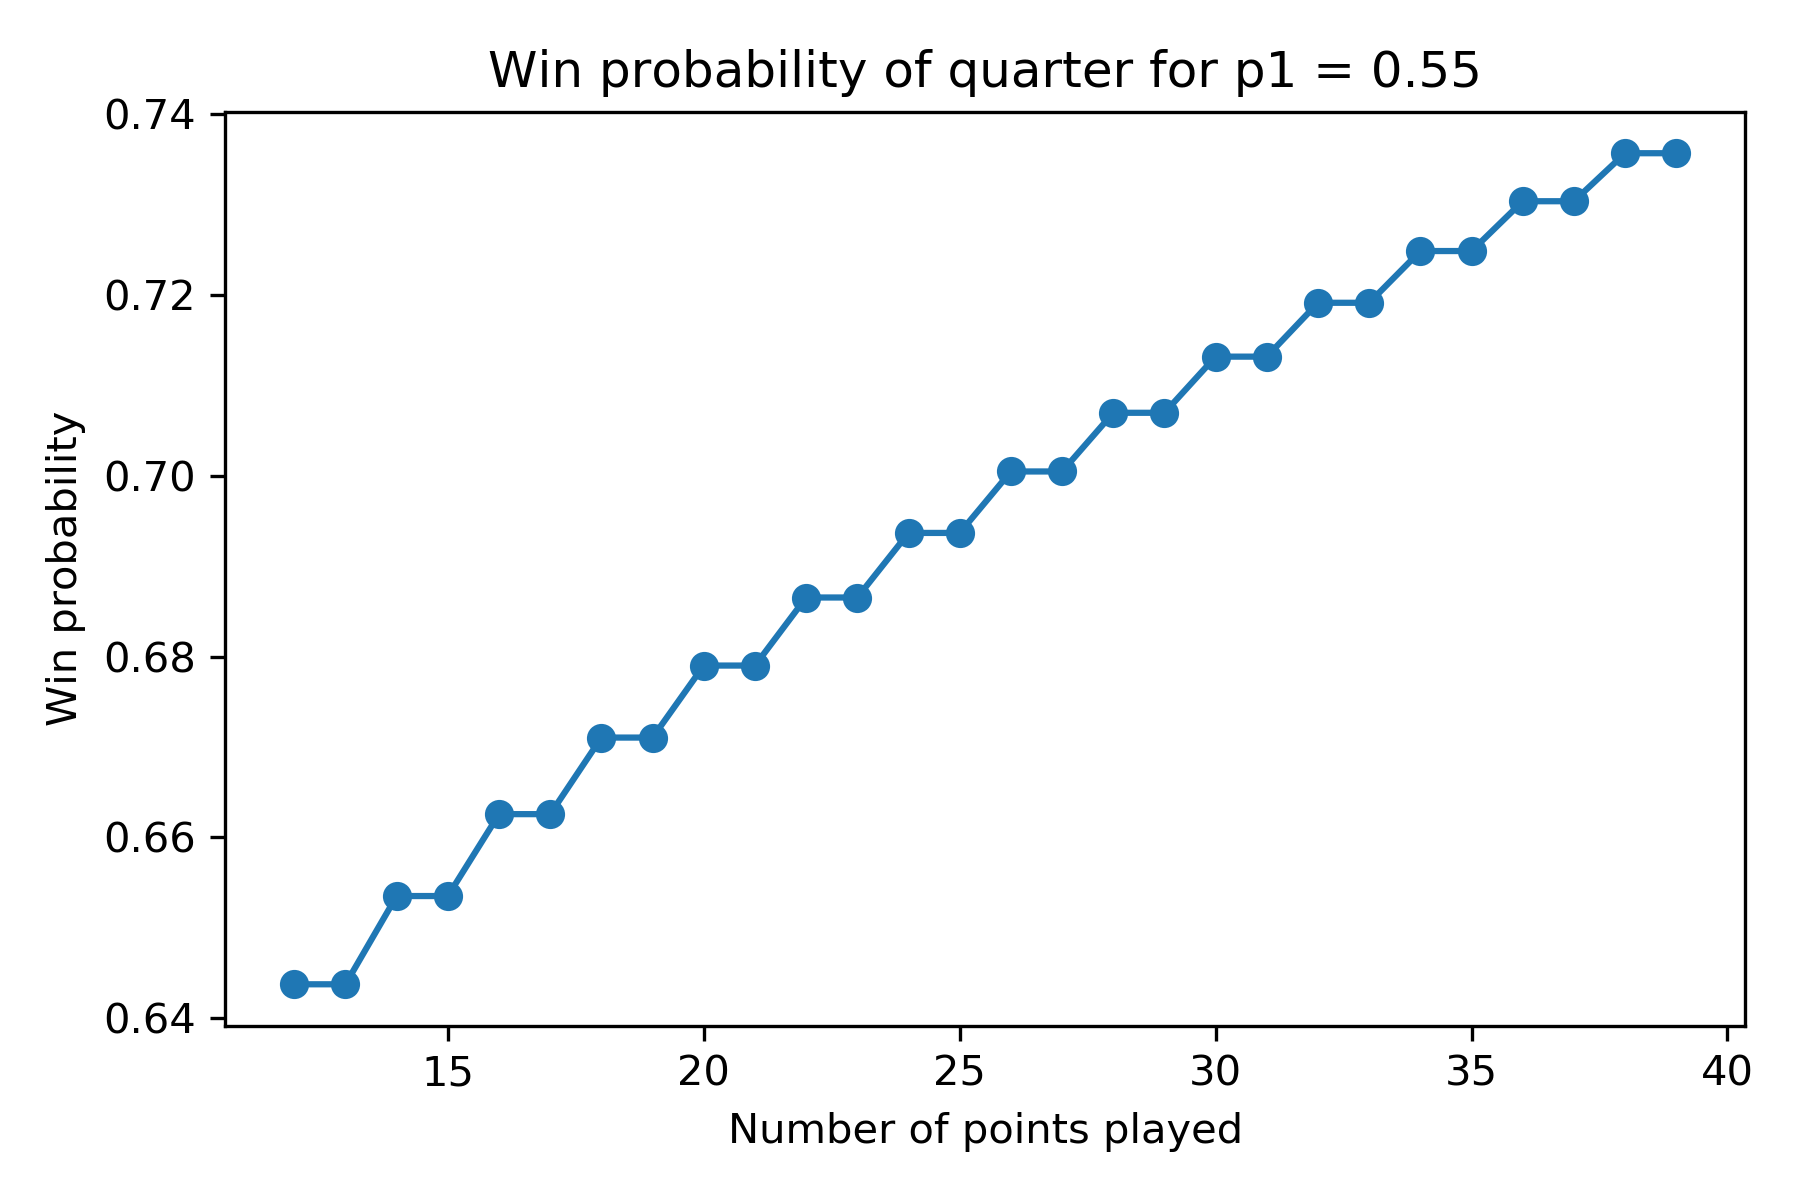
At first I thought something must be wrong because of the staircase shape. But actually, this is due to the possibility of a tie: if the number of points is even, there’s a possibility of an extra point being played as a result of a tie; if the number of points is odd, that’s not possible. This apparently results in the win probabilities being the same for pairs of consecutive point numbers.
Putting this together with the distribution of points, we can calculate:
$p(\textrm{win quarter}) = \sum_{k=1}^\infty p(\textrm{win quarter | k points played}) p(\textrm{k points played})$
In practice, we don’t have to go all the way to infinity since the probability of playing $k$ points drops rapidly above about 35 or so, so we can safely truncate the sum at 50 or so. For our assumption of $p_1 = 0.55$, this gives a 70% probability of winning a quarter.
Modelling the match win probability
Finally, we can use the win probability for each quarter to calculate the win probability of the entire match. Once again, there are two ways in which player 1 can win: either outright, winning three or four of the quarters; or they tie and win by sudden death. The sudden death case requires a player to win two points in succession. The first case is a sum of two Binomial probabilities, and a simple calculation gives that the second should be:
$p_{1sd} = \frac{p_1^2}{1 - 2 p_1 (1 - p_1)}$
Putting it together, we get:
$p(\textrm{win}) = \textrm{Binomial}(3 | 4, p_{quarter}) + \textrm{Binomial}(4 | 4, p_{quarter}) + \textrm{Binomial}(2 | 4, p_{quarter}) p_{1sd}$
where $p_{quarter}$ is the probability of winning a quarter.
How random is UTS?
So, with all the maths out of the way, how reliable is this format at picking the winner, and how does it compare to the usual formats? For the probabilities of $p_{S1} = 70\%$ and $p_{S2} = 60\%$ we were looking at before, which give $p_1 = 55\%$, we find:
$p(win) = 81\%$
Let’s put this into some context. With the same numbers, the probability of winning a tiebreak is:
$p_{tb}(win) = 66.3\%$
So, unsurprisingly, UTS is considerably better at picking the winner than a single tiebreak. What about a standard tennis set, with a possible tiebreak at 6-6? That gives:
$p_{set}(win) = 79.5\%$
What about Fast4? I simulated this (playing best of three sets) and found:
$p_{fast4}(win) = 81.2\%$
Finally, a standard best of three match would give:
$p_{bo3}(win) = 89.1\%$
So UTS seems to be about as good at picking the winner as a standard tennis set and a best of three Fast4 match, but quite a bit worse than a regular best of three match.
Variations
How do things change if we assume that each shot takes a bit longer – say, 2.5 seconds? In this case, the win probability drops to $79\%$. That makes sense, since this will mean that fewer points are played in each quarter, introducing more randomness.
What if we made each quarter a bit longer, say 15 minutes? In that case, the win probability rises to $85.2\%$.
That raises another question: how long would quarters have to be to equal the upset rate of a standard best of three match? I played around and found that quarters would have to be about 22 minutes long, but 20 minutes wouldn’t be too far off (88.2%).
What if we had two baseliners who, rather than the expected mean rally length of about 5 shots including serve, have only a 10% probability of ending each rally at each shot (10 shots per rally)? In that case, the win probability drops to $78.4\%$. Conversely, if players kept the points short, say at a mean length of 3 shots ($p = \frac{1}{3}$), the probability rises to $82.6\%$. So the format seems to have a slight sensitivity to the style of tennis played.
Finally, I was curious about another variation: what if we didn’t reset the score after each quarter, and just played 40 minutes straight? This simple format would have a probability of $84.9\%$ of picking the winner, making it considerably more efficient. I think this makes intuitive sense: a quarter could be won by one point, or by ten points, which should tell us something about the players’ relative skills, but summarising each quarter as simply “win” or “loss” discards it. A single long format would not discard any information about the margin of victory. Playing an hour would bring the probability up to 89.6%, surpassing the efficiency of a best of three match.
Conclusions
I had to make a number of assumptions in this analysis, and it’s entirely possible there is some bug somewhere. But assuming I got it all right, the results are quite interesting, I think.
Compared to Fast4, this format is an interesting alternative. Being exactly 40 minutes long makes it more predictable in length, while being just as good at picking the winner.
Compared to a standard best of three match, perhaps the format looks a bit less interesting. As mentioned before, it seems we would have to extend each quarter to 22 minutes to match its upset rate, which would mean a match duration of 88 minutes. This was initially a bit surprising to me, given that best of three matches are often around that length, despite players typically taking considerably longer breaks between points. Perhaps this is because best of three matches automatically “adapt”, ending more quickly when the difference in skills is large, and taking longer when it is small. For a lopsided match, UTS might be unnecessarily long. The 20-minute “extended” UTS format would however avoid very long matches (which sometimes can take 3h+), apparently without sacrificing predictability, which may be a benefit.
I only looked at one pair of serve-winning probabilities. I think it would be interesting to consider the full range, although hopefully not too much should be lost by fixing them to a single value.
Finally, I thought it was interesting to see that not resetting the score after each quarter would, at least in theory, result in a considerably more efficient format. Perhaps a one-hour contest following this format would be an interesting alternative to a best of three match, with a more predictable length and similar ability to pick the better player as the winner.